
Taking the Numb Out of Numbers
The Data Strategy and Analytics Team at Tulsa Public Schools is charting a new path to support teachers, school leaders, and staff in leveraging the power of information to better serve students.

Most people have probably heard that the modern world has entered the “Information Age”—a time period marked by rapid changes in technology and the opportunity to create new tools and generate data insights like never before.
However, while there are countless examples of how the private sector is leveraging data to create better services and products (think about how great all those Netflix viewing recommendations are…), the public sector has been slower to catch on.
Over the past few years, Tulsa Public Schools (TPS) has shifted from using data purely for collection and accountability purposes to leveraging it as a strategic asset to improve the experience of teachers, school leaders, and staff who support students. When Deborah Gist took over as the TPS superintendent in 2015, she created the Data Strategy and Analytics team to help chart the way forward. Since then, the TPS Data team, which includes three TFA alumni who have helped lead the way—Stephen Fedore Hoch (Connecticut ‘09), Sean Berkstresser (Greater Tulsa ‘11), and Holden Mitchell (Greater Tulsa ‘13)—has accomplished a lot.
Before the Data team was formed, Tulsa Public School team members often didn’t know where to go for the student information they needed, including student assessments, attendance records, and details on behavior. It was even more difficult for teachers. Critical data often got to people long after it was useful, if it ever got to them at all. As former teachers themselves, Stephen, Sean, and Holden had experienced this problem firsthand.

The Data team first launched a data request process to quickly establish itself as a helpful and supportive team for teachers, school leaders, and district staff. Soon, there was a backlog of nearly 100 data requests, which was a great indicator of the need for the Data team’s work. Here are just a few of the requests that came pouring in: What is my school’s attendance rate this month, and how does that compare to last year at the same time? Could you please provide the latest reading scores for students in our school’s reading intervention program? Do you have a way of helping us identify off-track students who are at risk of not graduating on time?
A few months later, the Data team released an internally developed data dashboard to get near-real time student data into the hands of staff members and help them to answer questions like these on-demand. One teacher submitted early feedback through the data dashboard saying, “This is the most amazing resource I’ve had the four years I’ve been teaching in TPS. What an idea, to gather all the relevant data in one place. Thank you, thank you for making a dream a reality!”
This early response showed the value of providing useful, timely data to educators, and the Data team hasn’t stopped since! Since then, the TPS Data team has continued its efforts to “take the numb out of numbers.” Take a look at some of the work the team is doing to provide teachers and other staff the tools they need to serve students.
The TPS Data Dashboard Is a One-Stop Shop for Essential Student Data
Teachers are confronted with hundreds of decisions throughout the day: whether to recommend repurchasing instructional software for the math department, prioritizing students for small-group reading instruction, or identifying parents to call home based on their students’ attendance trends, just to name a few. The goal of the TPS data dashboards is to become a one-stop shop for all essential student data so that teachers can spend less time searching for files or remembering which website to go to for what assessment, and more time supporting students in a data-informed way. Summary statistics such as reading growth by class or grade distribution by student subgroup are displayed in easy-to-understand views, but the dashboards also incorporate predictive analytics to help schools identify which students are most likely to be chronically absent, for example, so that staff can proactively plan supports.
In addition to providing insights, the dashboards also include tools to help save teachers’ time—for example, auto-generated attendance letters can be printed off and sent home to parents to promote good attendance habits, and visually appealing student summary reports can be a great addition for teachers to use during parent-teacher conferences. Teachers can even use the dashboards to create interventions for students, set follow-up reminders, and share notes with other colleagues in the building so that everyone can stay informed on what supports students are receiving. New features are developed through a user-centered approach in collaboration with school staff, and the team remains committed to listening to the district’s nearly 2,300 teachers and continuing to improve their supports to schools. During the 2018-19 school year, the average school day saw 225 users logging into the dashboards, and there were nearly 45,000 total login events over the course of the year.

Stakeholders Can Make Data Requests
As the center for data and information in Tulsa Public Schools, the Data team operates a request portal that allows stakeholders to submit requests for district data. Before, these requests could be lost in email inboxes or shuffled around various departments. Now, all data requests are managed centrally and the Data team can provide better service and easier access to the right data at the right time—in fact, they commit to fulfilling most requests within seven business days or fewer. Many data requests come from internal staff, and school-site requests are prioritized and often filled much sooner.
External partners such as Teach For America, Reading Partners, City Year, and other organizations critical to the success of TPS students have also been able to utilize the data request process in order to gain access to information that informs their work. Cross-training and regular meetings with partners helps the Data team maintain alignment with support organizations.
The Data Team Aids School Goal-Setting
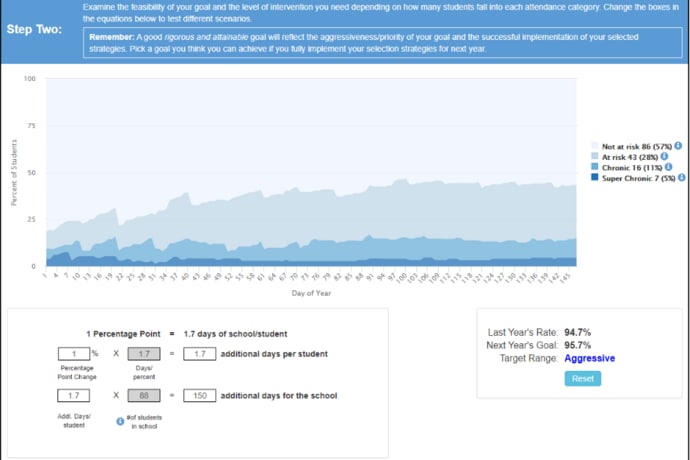
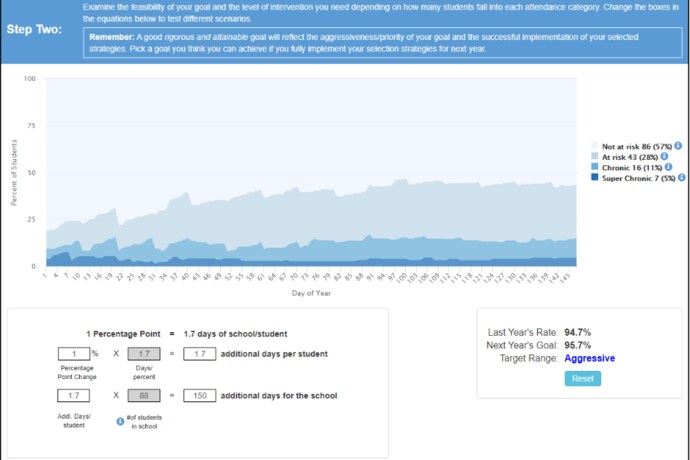
In addition to providing information, the Data team has also played an important role in shaping the district’s data strategy and direction. The team established the district’s school performance framework measures and helped develop a public reporting calendar so district staff and the community could be informed of progress. Many districts set performance targets centrally, but the Data team had a different idea—why not provide school leaders with resources so that they could set their own goals, relevant to their own contexts, which would then roll up to form the district’s overall goal for each measure?
To accomplish this revamped goal-setting process, the Data team worked closely with principals and their instructional leadership directors to understand what data could be helpful in supporting school leaders to set rigorous, but attainable, school goals. They used this feedback to create a set of interactive goal tools, housed on the data dashboards, that allowed principals to dig into their schools’ past trends, model future scenarios, and ultimately choose a goal that made sense given their school’s strategic plan and associated priorities. Today, TPS is in its third year of this process and the goal-setting has become an integral component of the annual school planning process—in fact, schools gather principals, assistant principals, teachers, and support staff in “school planning teams” that align on their school goals and develop strategies and plans to achieve them.
In early October at one of the Data team’s dashboard trainings, an elementary school dean approached Sean after the session and gave some really great feedback on ways a new feature to help staff track student child study process actions could be improved. He mentioned how the dashboard had become such an essential tool for him in his role, and that the Data team was “the best!” because of their fast service and ability to listen to what schools need and deliver the right data and tools.
Helping get educators like him the student information they need when they need it is what taking the numb out of numbers looks like in Tulsa. The Data team has been doing this for over three years now, and they can’t wait to keep finding new ways to help teachers, school leaders, and staff support students every day.
Sign up to receive articles like this in your inbox!
Thanks for signing up!
Content is loading...